Strategy Lab · AI backtesting
Describe a strategy. Get the real numbers.
Write your trading idea in plain English. Senntric’s Strategy Lab turns it into exact rules you can check, backtests them on up to 24 months of 5-minute data after costs, and then forward tests them on the live market. No code, and no made-up results.
How it works
From a sentence to a tested strategy.
01Describe it
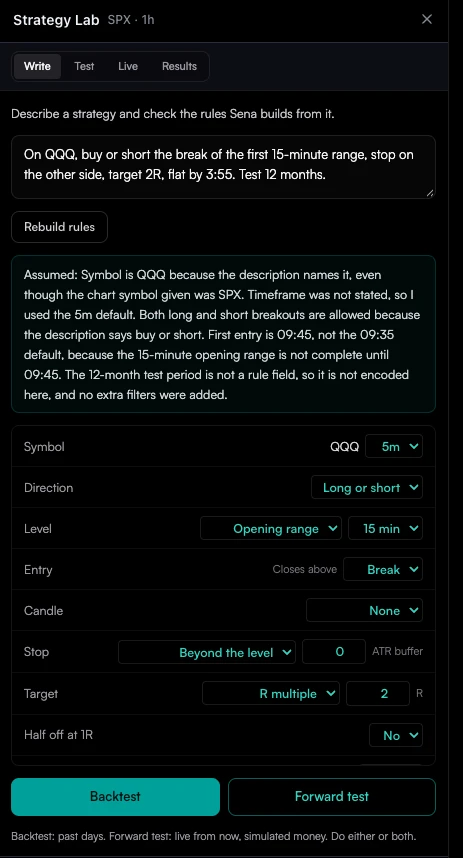
Write the idea the way you would say it: “Buy or short the break of the first 15-minute range, stop on the other side, target 2R, flat by 3:55.”
02Check the rules
Sena, Senntric’s AI, turns the sentence into rules and says what it assumed, such as the timeframe or the first entry time. Every rule is a dropdown or a number you can change.
03Backtest
Run the rules on 3, 6, 12 or 24 months of 5-minute history. You get the trades, the stats after costs, and which conditions helped or hurt.
04Forward test
Start the same rules on the live market with simulated money. Senntric tracks the trades on its own and tells you whether the results are on track with the backtest.
A real backtest
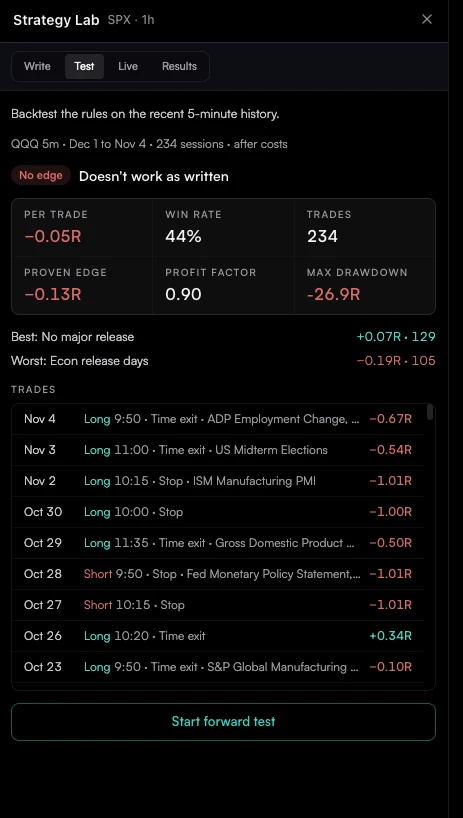
The 15-minute opening range breakout on QQQ.
We ran the rules above in Strategy Lab on November 5, 2026: December 1, 2025 to November 4, 2026, 234 sessions, after costs. Strategy Lab’s verdict was “No edge: doesn’t work as written.”
- Per trade
- −0.05R
- Win rate
- 44%
- Trades
- 234
- Proven Edge
- −0.13R
- Profit factor
- 0.90
- Max drawdown
- −26.9R
It lost a little on every trade. At −0.05R a trade and a 0.90 profit factor, the plain breakout gave back more than it made, with a −26.9R drawdown along the way.
The breakdown shows where. On days with a high-impact US economic release it averaged −0.19R over 105 trades. On the other 129 days it averaged +0.07R.
Skipping release days made money, but did not prove anything. With econ days skipped, the same rules made +0.07R a trade with a 1.16 profit factor. Proven Edge stayed below zero (−0.05R), and we chose that filter after seeing the results. The honest next step is a forward test, not real money.
Every run, including 5- and 30-minute ranges, is in the full opening range breakout backtest.
What you can test
Day-trading rules, built from real pieces.
Sena maps your idea onto these blocks and lists what it assumed, so nothing is filled in silently. You can change any of it before you test.
Levels
Opening range (5, 15 or 30 minutes), support/resistance zones, prior day’s high, low or close, premarket high or low, VWAP, or a moving average (SMA or EMA).
Entries
Break, touch, bounce or reclaim of the level, long, short or both.
Candle confirmation
None, engulfing, hammer or shooting star, or inside bar on the signal candle.
Conditions
Up to four filters: daily or intraday trend, RSI above or below a value, gap up or down, relative volume, and higher or lower volatility than usual.
Stops
Beyond the level or the signal candle (with an optional ATR buffer), an ATR multiple, or a percent of entry.
Targets
An R multiple, the next level, a trailing ATR stop, or no target with a time exit. Optionally take half off at 1R and move the stop to entry.
Timing
5-minute, 15-minute or 1-hour candles; an entry window and a flat time in New York time; up to five trades a day.
Calendar
Trade or skip high-impact US economic release days and the symbol’s earnings days.
How trades are filled
Built not to flatter you.
Most backtests look better than live trading because of how fills, ties and costs are handled. These are Strategy Lab’s rules.
Signals wait for the close
A signal candle must close before it counts, and the trade fills at the next candle’s open, not at the level.
The stop wins ties
When one candle reaches both the stop and the target, the stop counts.
Gaps fill at the open
If price gaps through the stop or target, the fill is the open, which can be worse than planned.
Costs come off every trade
Two cents a share round trip is deducted from each result.
No look-ahead
Levels and conditions only use what was known before the signal: support and resistance are mapped from earlier sessions, the daily trend reads yesterday’s close, and indicators read closed candles.
Results in R
Every trade is measured in R, its result divided by the risk to the stop. Strategy Lab shows win rate, average R, profit factor, max drawdown in R, Proven Edge, and the results split by econ days, gaps, entry time and side.
Ways to backtest
Code, replay, or plain English.
Three common ways to test a trading idea, and what each one costs you.
Code it yourself
Pine Script in TradingView’s Strategy Tester, or Python
Any rule you can program, on any market your data covers.
You have to write and debug code, and fill and cost assumptions are yours to get right.
Manual bar replay
Replaying old charts candle by candle and logging trades
Practices discretion and execution, not just rules.
Slow, so samples stay small, and it is easy to see what happens next by accident.
Plain English to rules
Senntric Strategy Lab
No code. Sena writes the rules, and you check and edit them before anything runs.
Only the building blocks listed below. If a rule is not in the list, it cannot be tested yet.
Honest limits
What Strategy Lab doesn’t do.
Why a good backtest still needs a live test: forward testing vs backtesting.
US stocks and ETFs, regular session
Backtests run on regular-session candles. Options, futures, forex and crypto backtests are not supported.
History depends on the archive
You can ask for up to 24 months (12 for support and resistance). When a symbol’s archive is shorter, the test starts later and says so.
One level per strategy
A strategy trades one kind of level with up to four conditions. Multi-leg or portfolio strategies are not supported.
No real orders
Forward tests use simulated money. Strategy Lab never sends orders to a broker.
Past results are not a forecast
A backtest describes the past under the rules as written. Markets change, and a good backtest can still fail live. That is what the forward test is for.
Questions traders ask
AI backtesting FAQ
What is AI backtesting?
AI backtesting means describing a trading strategy in plain language and letting software turn it into exact rules and test them on historical prices. In Senntric’s Strategy Lab, the AI only writes the rules. A separate engine runs them on real 5-minute market data, so the results come from the data, not from the AI.
Can ChatGPT or Claude backtest a trading strategy?
A general chatbot can help you write rules or code, but on its own it has no market history to run them on, so any numbers it gives you can be made up. Use a tool that runs the rules on stored price data and shows you every trade.
Do I need to know Pine Script or Python?
No. You describe the strategy in a sentence, then adjust the rules with dropdowns and number boxes. You never see code.
How much history does Strategy Lab use?
You choose 3, 6, 12 or 24 months of 5-minute history. Support-and-resistance strategies are capped at 12 months. If a symbol’s archive does not go back that far, the test says how much it actually covered.
Does the backtest include trading costs?
Yes. Two cents a share round trip is taken off every trade, and every result is shown after costs.
What is Proven Edge?
It is a conservative estimate of the average result per trade, in R: the lower end of a one-sided 90% confidence range. Strategy Lab shows it once a test has at least 30 trades. If it is above zero, the profit is unlikely to be luck alone. If it is below zero, the backtest has not proven an edge, even if it made money.
What is the difference between a backtest and a forward test?
A backtest runs the rules on past data. A forward test runs the same rules on the live market from now on, with simulated money, so the result cannot be fitted to history. Read forward testing vs backtesting.
Which markets can I backtest?
US stocks and ETFs, on 5-minute, 15-minute or 1-hour rules during the regular session. Options, futures, forex and crypto are not supported in Strategy Lab.
Test before you trade
Find out if it works. Before your money does.
Describe a strategy, check the rules, backtest it after costs and forward test it live, next to the news, alerts and charts you already trade with.
Get started