Market internals
Risk-on or risk-off?
Six market internals show whether investors want risk or are running from it. Here is what each one asks, how to read it, and how they add up, using one real day as the example.
Risk Appetite November 6, 2026
Defensive · 3 of 5The idea
Risk-on vs risk-off, in plain words.
An index level tells you where the market is. It doesn’t tell you what kind of money is moving. Two days with the same S&P 500 close can look very different underneath: on one, buyers are reaching for the riskiest stocks; on the other, they are sheltering in utilities and paying up for options protection.
A risk appetite indicator compares something risky with something safe, so it shows which side is winning. One such ratio can mislead, because each has its own quirks. Reading several together, each asking a different question, gives a fuller answer. Those are the market internals below.
Risk-on looks like
- High-beta stocks beating low-volatility ones
- The average stock keeping up with the giants
- Small caps holding up
- Credit spreads tight or tightening
- A low or falling VIX
Risk-off looks like
- Low-volatility stocks taking the lead
- A few giants carrying the index
- Small caps sold first
- Credit spreads widening
- A rising VIX
Six questions
The six market internals and what each asks.
Each one is a ratio or a price that answers one question about risk. The worked example is November 6, 2026, a week into the November Nasdaq correction.
- 01Nov 6: Defensive
High beta vs low volatility
SPHB ÷ SPLV
Are investors buying the fast-moving stocks or the steady ones?
Rising: money is chasing the most volatile S&P 500 stocks. Risk-on.
Falling: money is moving to steadier, lower-volatility stocks. Defensive.
November 6 (1.671, −21.8% in 20 days): Fast-moving stocks lost about 22% against steady ones in a month, the clearest risk-off move on the board.
How this ratio behaved after every big rise and 20% fall since 2011: our 15-year SPHB/SPLV study.
- 02Nov 6: Broadening
Equal weight vs cap weight (market breadth)
RSP ÷ SPY
Is the average stock keeping up with the giants?
Rising: the average S&P 500 stock is beating the largest ones. Broad participation.
Falling: a few giants are carrying the index. Narrowing.
November 6 (0.294, +7.4% in 20 days): The average stock was beating the giants, so money was spreading out rather than leaving.
- 03Nov 6: Risk-on
Small caps vs large caps
Russell 2000 ÷ S&P 500
Are small companies keeping up with big ones?
Rising: investors are willing to own smaller, more economically sensitive companies. Risk-on.
Falling: they are hiding in large, established companies. Defensive.
November 6 (0.373, +3.9% in 20 days): Small caps were slightly ahead, not being dumped.
- 04Nov 6: Widening
High-yield credit spread
US high-yield bond spread
How much extra interest do riskier companies pay to borrow?
Widening: lenders want more to take credit risk. Risk-off.
Tightening: lenders are relaxed about defaults. Risk-on.
November 6 (3.48%, +0.37 pts in 20 days): Up from about 3.1% to 3.5% in a month. Lenders a little more nervous, far from panic.
- 05Nov 6: Elevated
VIX
S&P 500 implied volatility
How much fear is priced into S&P 500 options?
Rising: traders are paying more for protection. Elevated.
Falling: protection is cheap and the market is calm. Calm.
November 6 (25.64, +10.80 in 20 days): Up from about 15 to 25.6 in a month: people were paying up for protection.
- 06Nov 6: Tech lags
Nasdaq-100 vs S&P 500
NDX ÷ SPX
Is tech leading or lagging the market?
Rising: tech is leading.
Falling: tech is lagging.
November 6 (3.659, −7.5% in 20 days): Tech fell 7.5% against the S&P 500 in a month. Shown for context: a tech lag can be a rotation inside a healthy market, so it is not counted.
Reading one internal
Two checks, one read.
For each internal, ask two things: is it above or below its 50-day average, and is it up or down over the last 20 sessions? When both agree, the read is clear. When they disagree, it is mixed. For the VIX and credit spreads the direction flips: rising means risk-off.
Above its 50-day average, up over 20 days
Risk-onBelow its 50-day average, down over 20 days
DefensiveAbove the average, but down over 20 days
MixedBelow the average, but up over 20 days
MixedPutting it together
Three of five sets the stance.
The overall stance is set when at least three of the five counted internals point the same way: risk-on, defensive, or mixed if neither side reaches three. Nasdaq-100 ÷ S&P 500 is shown for context and never counted, because tech lagging can be a rotation inside a healthy market.
On November 6, 2026 the stance was Defensive, 3 of 5. High beta vs low volatility, credit spreads and the VIX read defensive. Equal weight and small caps read risk-on.
That split matters. Money was leaving the crowded AI and high-flying names, not stocks as a whole, which looks more like a rotation than a stampede. The worse version is equal weight and small caps turning defensive too: then the selling has spread from the leaders to everyone.
November 6, 2026
- High Beta ÷ Low VolDefensive
- Equal Weight ÷ Cap WeightBroadening
- Small ÷ Large CapsRisk-on
- High-Yield Credit SpreadWidening
- VIXElevated
Reading the chart
Support, double tops and momentum.
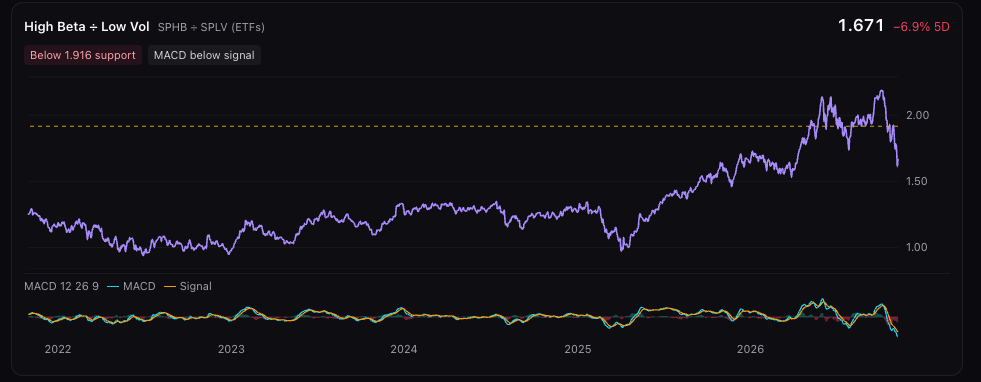
- Main line
- The internal you picked, High Beta ÷ Low Vol by default.
- Dashed amber line
- Support: the latest swing low of the past six months. A close below it shows risk appetite breaking down.
- Amber dots
- A double top: two similar peaks with the line now back below them.
- Bottom panel
- MACD momentum. Bars above zero mean momentum is improving; the blue line crossing above the orange one means it is turning up.
- Red “off 1-year high” flag
- Appears when High Beta ÷ Low Vol closes 20% or more below its 1-year high, with the size of the fall. At the November 6, 2026 close it read “24% off 1-year high”.
Context, not signals
We tested support breaks, double tops and MACD crosses on this ratio. On their own they had little edge, so the panel shows them as the chart’s current state, not as buy or sell signals. What did stand out was a deep fall from the high, the condition the red flag marks: after each of the six earlier 20% falls since 2012, the S&P 500 was lower a month later. Six cases are a pattern, not a forecast. See the study.
Using it
How traders use risk appetite.
- 01
Set the backdrop
Breakouts and momentum tend to work better in risk-on markets. On defensive days many traders trade smaller and take profits sooner.
- 02
Look for agreement
One internal turning is noise more often than not. Three or more turning together is a change in mood.
- 03
Watch the spread
When the leaders weaken but breadth holds, it is a rotation. When breadth follows, the selling is broad.
- 04
Keep it as context
Internals describe the market now. They are not a timing tool, and none of this is investment advice.
Senntric Pro · Risk Appetite
Risk-on or risk-off? See it every day.
- Six internals on one board, each read for you
- One stance a day: risk-on, mixed or defensive
- Next to Market Health, your charts, news and squawk
In the terminal, open the command bar and type “risk appetite”.
Questions traders ask
Risk-on vs risk-off FAQ
What does risk-on vs risk-off mean?
Risk-on describes a market where investors are willing to own riskier assets, such as volatile stocks, small caps and high-yield bonds. Risk-off is the opposite: money moves to steadier stocks, safer bonds and cash, and the price of protection rises.
Is the market risk-on or risk-off right now?
At the November 6, 2026 close it was defensive, 3 of 5: high beta vs low volatility, credit spreads and the VIX read risk-off, while equal weight and small caps still read risk-on. The reading changes daily; Senntric’s Risk Appetite panel shows the current one.
What is a risk appetite indicator?
A measure that shows how willing investors are to take risk, usually by comparing a risky asset with a safer one. The high beta vs low volatility ratio (SPHB ÷ SPLV) is one of the simplest. Credit spreads, the VIX and small caps against large caps answer the same question from other angles.
What are market internals?
Measures of what is happening inside the market, beneath the index level: which kinds of stocks are leading, how many are taking part, and what bond and options traders are pricing. Day traders also use the term for intraday gauges such as the NYSE TICK and advance-decline line. This guide covers the daily internals that show risk appetite.
What does a widening high-yield credit spread mean?
Lenders are demanding more extra interest to lend to riskier companies, usually because they expect more defaults. It is a risk-off sign. A spread of around 3% to 4% is calm by historical standards; it rose above 10% in the 2008 crisis and in March 2020.
What VIX level is considered high?
The VIX has averaged around 19 to 20 over its history. Readings in the low teens mean the market is calm, the mid-20s mean elevated fear, and readings above 30 have usually come with sharp selloffs. The direction matters as much as the level: a jump from 15 to 25 in a month says more than a steady 25.
Is equal weight beating cap weight bullish?
It means more stocks are taking part, which markets usually treat as healthy. A rally carried by a handful of giants is narrower and more fragile. On its own it is not a buy signal; read it with the other internals.
Where can I see these risk appetite indicators together?
Senntric’s Risk Appetite panel shows all six on one board with a daily read for each and an overall stance. It is part of Senntric Pro: open the command bar in the terminal and type “risk appetite”.