Market risk · Senntric data study
Is the Stock Market Going to Crash? What 15 Years of High-Beta vs Low-Volatility Data Say
High-beta stocks against low-volatility stocks is one of the simplest risk appetite indicators: when traders want risk, the ratio climbs. It set a record in October 2026, then fell 20% in four weeks. We tested every 20% fall and every big run-up in the SPHB/SPLV ratio since 2011 against what the S&P 500 did next.
Key findings
- 2.19Record high on October 5, 2026Highest since SPHB launched in 2011. Yearly highs before 2020 sat near 0.98 or lower
- 6 of 6Times the S&P 500 was lower a month after a 20% fallBy 5.0% to 11.3%. On a random day it was lower 33% of the time
- 5 of 6Higher again 12 months laterOnly 2022 was still lower, 5.8% down
- 6 of 6Big run-ups followed by a higher marketThree months after a 40% rise in a year. The record itself was not the warning
01 / Short answer
The record was not the warning. The 20% fall was.
The high beta vs low volatility ratio climbed for years and set a record of 2.19 on October 5, 2026. Big run-ups like that were not bearish on their own: after each one, the S&P 500 was higher three months later.
A sharp fall from the high was different. Each of the six earlier times the ratio closed 20% below its 1-year high, the S&P 500 was lower a month later, by 5.0% to 11.3%. In five of the six it was higher again a year later. The ratio crossed that line again on November 2, 2026.
02 / What it measures
High beta vs low volatility: a simple risk-on/risk-off gauge
SPHB, the Invesco S&P 500 High Beta ETF, holds the 100 S&P 500 stocks that have moved most with the market over the past year. SPLV, the Invesco S&P 500 Low Volatility ETF, holds the 100 with the lowest volatility. Dividing one by the other gives a single line for risk appetite.
When the SPHB/SPLV ratio rises, aggressive stocks are beating defensive ones and investors are risk-on. When it falls, money is moving to steadier names: risk-off. Because both funds come from the same index, the ratio compares two kinds of stock inside one market rather than the market against something else. High-beta stocks tend to lead rallies, so the ratio and the S&P 500 often rise together.
- High beta tends to mean fast-moving growth stocks such as chipmakers, plus cyclicals that swing with the economy.
- Low volatility tends to mean utilities, consumer staples, insurers and other steady earners.
- Both rebalance each quarter, so the mix changes with the market. The ratio’s level is less comparable over time than its moves.
03 / The 2026 record
The ratio hit 2.19, more than double its pre-2020 highs
From 2011 to 2019 the ratio topped out between 0.84 and 0.98 every year. It broke above 1.0 in 2020, reached 1.35 in 2024 and 1.71 in 2025, then 2.19 on October 5, 2026. The red dots mark each time it later closed 20% below its 1-year high.
Source: Senntric stored daily closes for SPHB, SPLV and the S&P 500, May 5, 2011 to November 6, 2026.
| Year | Highest close |
|---|---|
| 2011 | 0.981 |
| 2012 | 0.857 |
| 2013 | 0.923 |
| 2014 | 0.974 |
| 2015 | 0.951 |
| 2016 | 0.927 |
| 2017 | 0.913 |
| 2018 | 0.967 |
| 2019 | 0.841 |
| 2020 | 1.047 |
| 2021 | 1.293 |
| 2022 | 1.216 |
| 2023 | 1.333 |
| 2024 | 1.350 |
| 2025 | 1.708 |
| 2026 | 2.188 |
Source: Senntric stored daily closes for SPHB, SPLV and the S&P 500, May 5, 2011 to November 6, 2026.
04 / Run-ups
Big run-ups in risk appetite were not bearish
It is tempting to read a record in risk appetite as a sign of excess. The data does not support that on its own. Six times the ratio rose 40% or more within a year. Three months later, the S&P 500 was higher every time, by 2.5% to 13.4%.
| Run-up reached | Ratio | 3 months | 6 months | 12 months |
|---|---|---|---|---|
| November 21, 2016 | 0.89 | +7.5% | +9.4% | +18.2% |
| May 27, 2020 | 0.82 | +13.4% | +17.8% | +38.2% |
| May 26, 2021 | 1.24 | +7.2% | +11.8% | −5.2% |
| December 21, 2023 | 1.33 | +9.9% | +15.2% | +25.9% |
| July 2, 2025 | 1.36 | +7.8% | +9.9% | +21.0% |
| July 6, 2026 | 1.97 | +2.5% | — | — |
Source: Senntric stored daily closes for SPHB, SPLV and the S&P 500, May 5, 2011 to November 6, 2026.
Strong risk appetite tends to persist. A market where high-beta stocks lead is usually a rising market, and that was true after the July 2026 run-up as well.
Key finding
05 / 20% falls
After every 20% fall, the S&P 500 was lower a month later
The ratio closed 20% below its 1-year high six times from 2012 to 2025. In all six, the S&P 500 was lower 21 sessions later, by 8.7% on average. On a random day in the same years, the index was lower a month later only 33% of the time and up 1.0% on average.
| Ratio fell 20% | From high of | 1 month | 3 months | Worst, 6 mo | 12 months |
|---|---|---|---|---|---|
| May 4, 2012 | 0.98 (May 2011) | −6.1% | +1.6% | −6.7% | +19.3% |
| December 14, 2015 | 0.95 (May 2015) | −5.0% | +0.3% | −9.5% | +12.4% |
| November 19, 2018 | 0.97 (June 2018) | −8.3% | +3.8% | −12.6% | +15.5% |
| March 6, 2020 | 0.84 (April 2019) | −10.4% | +7.5% | −24.7% | +28.6% |
| April 21, 2022 | 1.29 (November 2021) | −11.2% | −9.8% | −18.6% | −5.8% |
| March 10, 2025 | 1.35 (July 2024) | −11.3% | +7.0% | −11.3% | +20.7% |
| November 2, 2026 (now) | 2.19 (October 2026) | — | — | −2.5% so far | — |
Source: Senntric stored daily closes for SPHB, SPLV and the S&P 500, May 5, 2011 to November 6, 2026.
Source: Senntric stored daily closes for SPHB, SPLV and the S&P 500, May 5, 2011 to November 6, 2026.
The worst point within six months ranged from 6.7% in 2012 to 24.7% in 2020. Most of the damage came early: in five of the six cases the six-month low came within the first two months. 2022 was the exception, sliding for most of the six months.
06 / A year later
A year later, the S&P 500 was higher in 5 of 6 cases
The weakness did not last. Twelve months after the trigger the S&P 500 was up 15.1% on average, close to its normal year in this period (13.3%). The one exception was April 2022, when the Fed’s rate hikes kept stocks falling into October and the index was still 5.8% lower a year on.
For a trader, the two answers fit together. A break in risk appetite has meant a rough few weeks. For a longer-term investor, it has rarely been the start of a lasting bear market.
07 / November 2026
The fastest 20% fall on record
The ratio fell from 2.19 on October 5, 2026 to 1.74 on November 2, 2026, 20% in 20 sessions. Every earlier 20% fall took between 5 and 12 months. By November 6, 2026 the ratio was 1.67, 23.6% below the record, and the S&P 500 had been at most 2.5% below its trigger close.
The speed reflects how concentrated the high-beta side had become: the same AI and chip stocks that drove the record led the November Nasdaq correction. Whether this case follows the earlier six is not known yet. Its one-month mark is the close on December 2, 2026.
08 / Using it
How to use the high beta vs low volatility ratio
- Read the trend, not the level. A record ratio was not a warning. Rising risk appetite has usually meant a rising market.
- Watch the distance from the high. A 20% close below the 1-year high has marked a weak month every time so far. Smaller pullbacks were common and said less.
- Confirm with other gauges. Credit spreads, market breadth and small caps against large caps answer the same risk-on/risk-off question from other angles. A break that shows up in several is more meaningful. Our guide to risk-on vs risk-off indicators explains how to read each one.
- Size, don’t predict. After a break, smaller positions and wider stops suit a market that has tended to swing harder for a few weeks. That holds whether or not the drop comes.
- Remember the year. Five of six breaks were followed by a higher market twelve months on. The pattern is about the next weeks, not a bear-market call.
09 / In Senntric
The Risk Appetite panel in Senntric
Senntric’s Risk Appetite panel charts the high beta vs low volatility ratio every day, next to equal-weight vs cap-weight, small caps vs large caps, credit spreads and the VIX. It gives one read, risk-on, mixed or defensive, from how many of them agree. The ratio is also one of the five parts of Senntric’s Market Health score, which we tested in our study of stock market crash indicators.
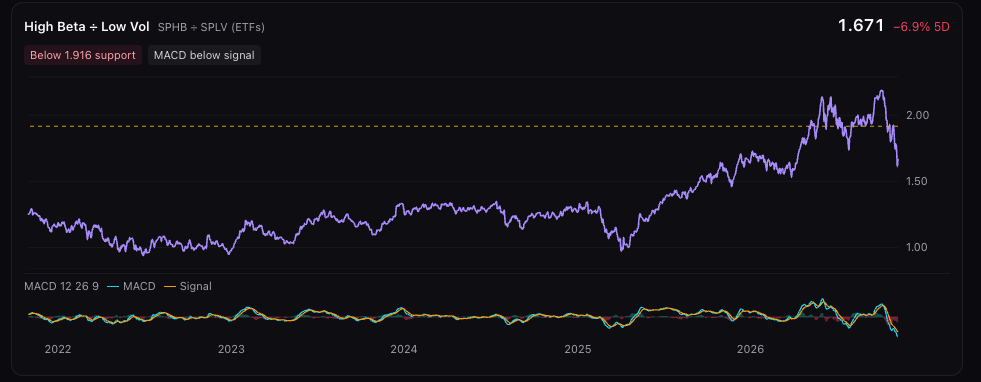
Senntric Risk Appetite panel (Pro), session of November 6, 2026.
Since November 8, 2026 the chart also flags the condition this study measures. When High Beta ÷ Low Volatility closes 20% or more below its 1-year high, a red chip appears on it with the size of the fall. At the November 6, 2026 close it read 24% off 1-year high. Pro members open the panel from the command bar by typing “risk appetite”.
FAQ
Questions about high beta vs low volatility
Is the stock market going to crash?
Nobody can say for sure, and this study is not a forecast. What it shows: on November 2, 2026 high-beta stocks closed 20% below their 1-year high against low-volatility stocks. The six earlier times that happened, the S&P 500 was lower a month later, by 5.0% to 11.3%, and its worst point within six months ranged from 6.7% to 24.7%. A year later it was higher in 5 of the 6. History points to a rough few weeks more often than a lasting crash.
What is the SPHB/SPLV ratio?
It divides the price of the Invesco S&P 500 High Beta ETF (SPHB) by the price of the Invesco S&P 500 Low Volatility ETF (SPLV). SPHB holds the 100 S&P 500 stocks that have moved most with the market over the past year; SPLV holds the 100 with the lowest volatility. When the ratio rises, investors are paying up for risk. When it falls, they are moving to defensive stocks.
Is high beta vs low volatility a risk-on/risk-off indicator?
Yes, it is one of the most used. A rising ratio is read as risk-on and a falling one as risk-off. In our 15-year test the level on its own said little: after every 40% run-up the S&P 500 was higher three months later. A sharp fall from the high said more.
What happened when the high beta vs low volatility ratio fell 20%?
Six times from 2012 to 2025 the ratio closed 20% below its 1-year high. The S&P 500 was lower one month later all six times, by 5.0% to 11.3%, and fell between 6.7% and 24.7% at its worst within six months. A year later it was higher in 5 of the 6 cases.
Why did the ratio hit a record in 2026?
High-beta stocks led a strong market, and SPHB was heavily weighted in AI and semiconductor stocks after its quarterly rebalances. The ratio reached 2.19 on October 5, 2026, against yearly highs near 1.0 before 2020. Part of that level reflects the fund’s concentration, so the size of a fall compares across years better than the level does.
Does a falling ratio mean a stock market crash is coming?
No. Six cases describe what happened, not what has to happen next. In two of them, November 2018 and March 2020, the selloff was already under way when the ratio crossed the line. Treat a sharp fall as a sign that risk appetite has turned, and size positions for it, rather than as a crash call.
Method
How we measured it
Ratio. The daily close of SPHB divided by the daily close of SPLV, 3,901 sessions from May 5, 2011 (SPHB’s first month) to November 6, 2026. Closes are split-adjusted without dividends, so the ratio tracks price only. The S&P 500 is the index close.
20% fall. The first session the ratio closes at least 20% below its highest close of the previous 252 sessions (one trading year). A full year of history is required, and a new case must come at least 252 sessions after the last one. The ratio also fell 20% from its early high in August 2011, three months after SPHB launched, before a 1-year high could be measured. It is not counted; the S&P 500 was 7.1% higher a month later.
40% run-up. The first session the ratio closes at least 40% above its lowest close of the previous 252 sessions, with the same spacing.
Returns. S&P 500 change from the trigger close after 21, 63, 126 and 252 sessions (one, three, six and twelve months). “Worst within six months” is the lowest close in the next 126 sessions against the trigger close. Base rates use every session with a full window.
Sources
Sources and disclaimer
- Senntric stored daily closes
Invesco S&P 500 High Beta ETF (SPHB), Invesco S&P 500 Low Volatility ETF (SPLV) and the S&P 500 index. - Study snapshot
The rows behind every figure on this page, frozen on November 7, 2026, with the script that computes them.
Six counted cases are too few for a reliable rate, and the result describes what happened, not a forecast. Some triggers came after a selloff had begun (November 2018, March 2020). SPHB rebalances each quarter into the most volatile S&P 500 stocks, heavily AI and semiconductors in 2026, so the record level partly reflects that mix. This is research, not investment advice. This research is educational. It is not a forecast, a recommendation, or investment advice, and past moves do not predict future ones.
Senntric Pro · Risk Appetite
Risk-on or risk-off? See it every day.
- Flags the ratio when it closes 20% or more below its 1-year high, the exact condition this study tested
- Six internals on one board, each read for you
- One stance a day: risk-on, mixed or defensive
- Next to Market Health, your charts, news and squawk
In the terminal, open the command bar and type “risk appetite”.