Senntric for market researchers
Market research tools that measure the reaction.
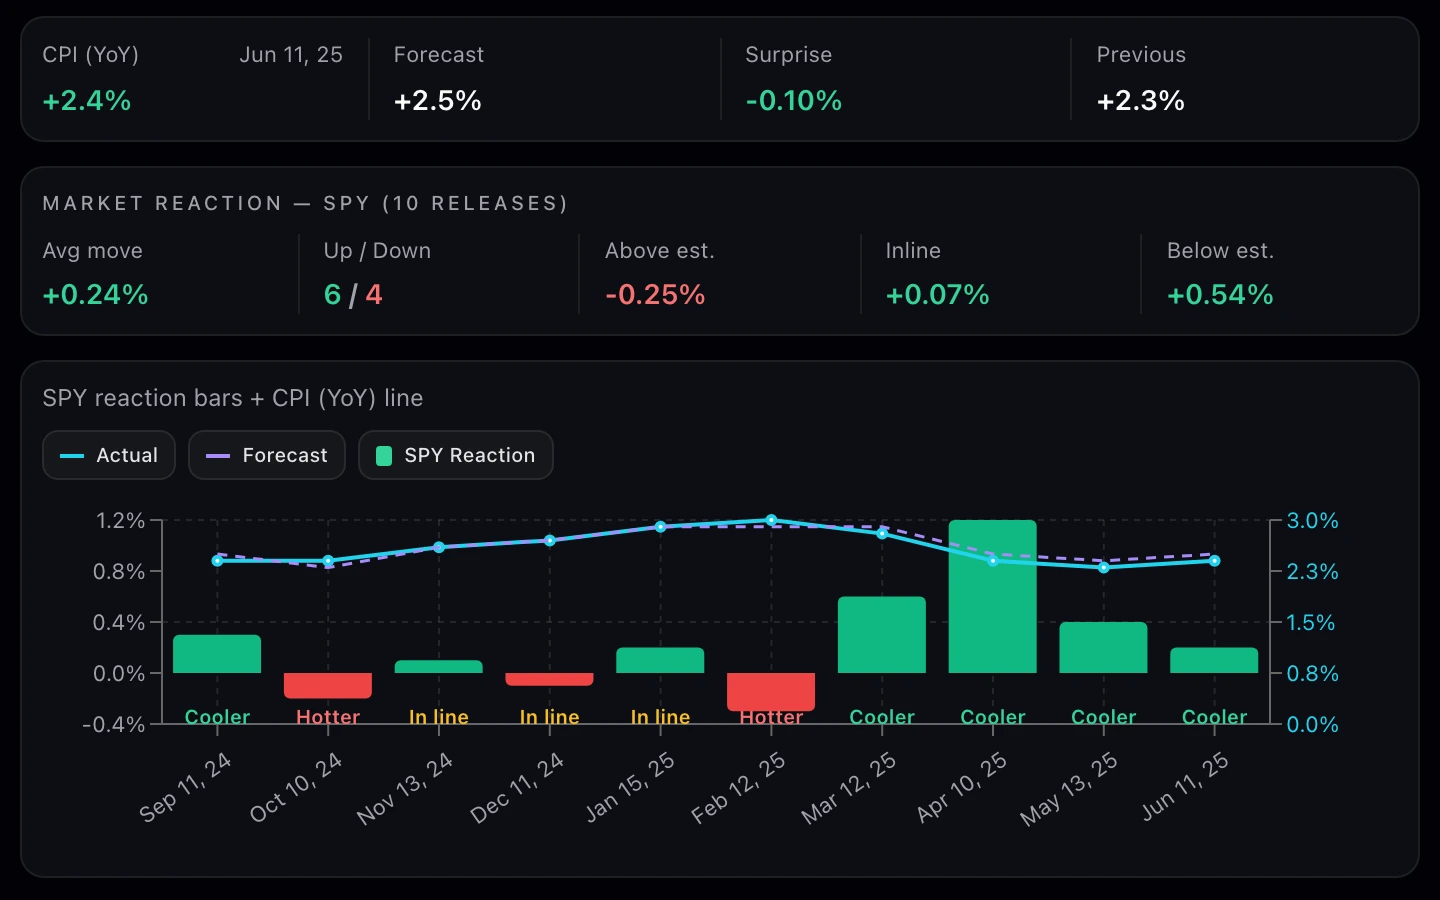
How did SPY trade after the last ten CPI prints? How has NVDA done against estimates? Which sectors lead? The event, the expectation and the reaction, together.
In the terminal
Research questions, answered in one place.
Earnings history
How does this stock do against estimates?
EPS and revenue against estimates for eight quarters, the beat rate, the surprise and the one-day move after each report.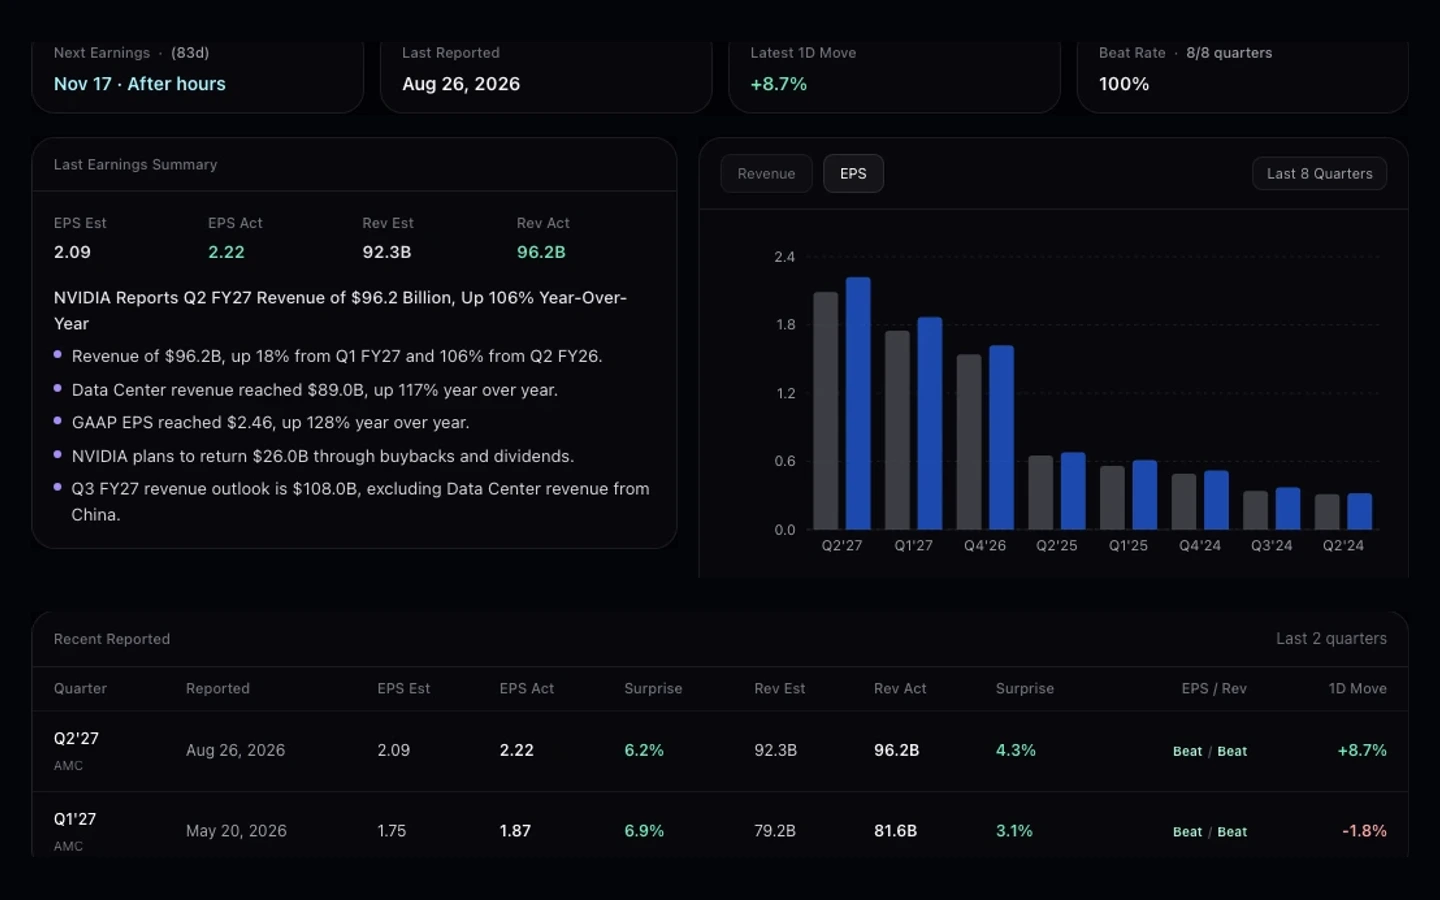
Sector rotation
Where is money rotating?
Each sector indexed to SPY from one week to one year. Lines above 100 are beating the market.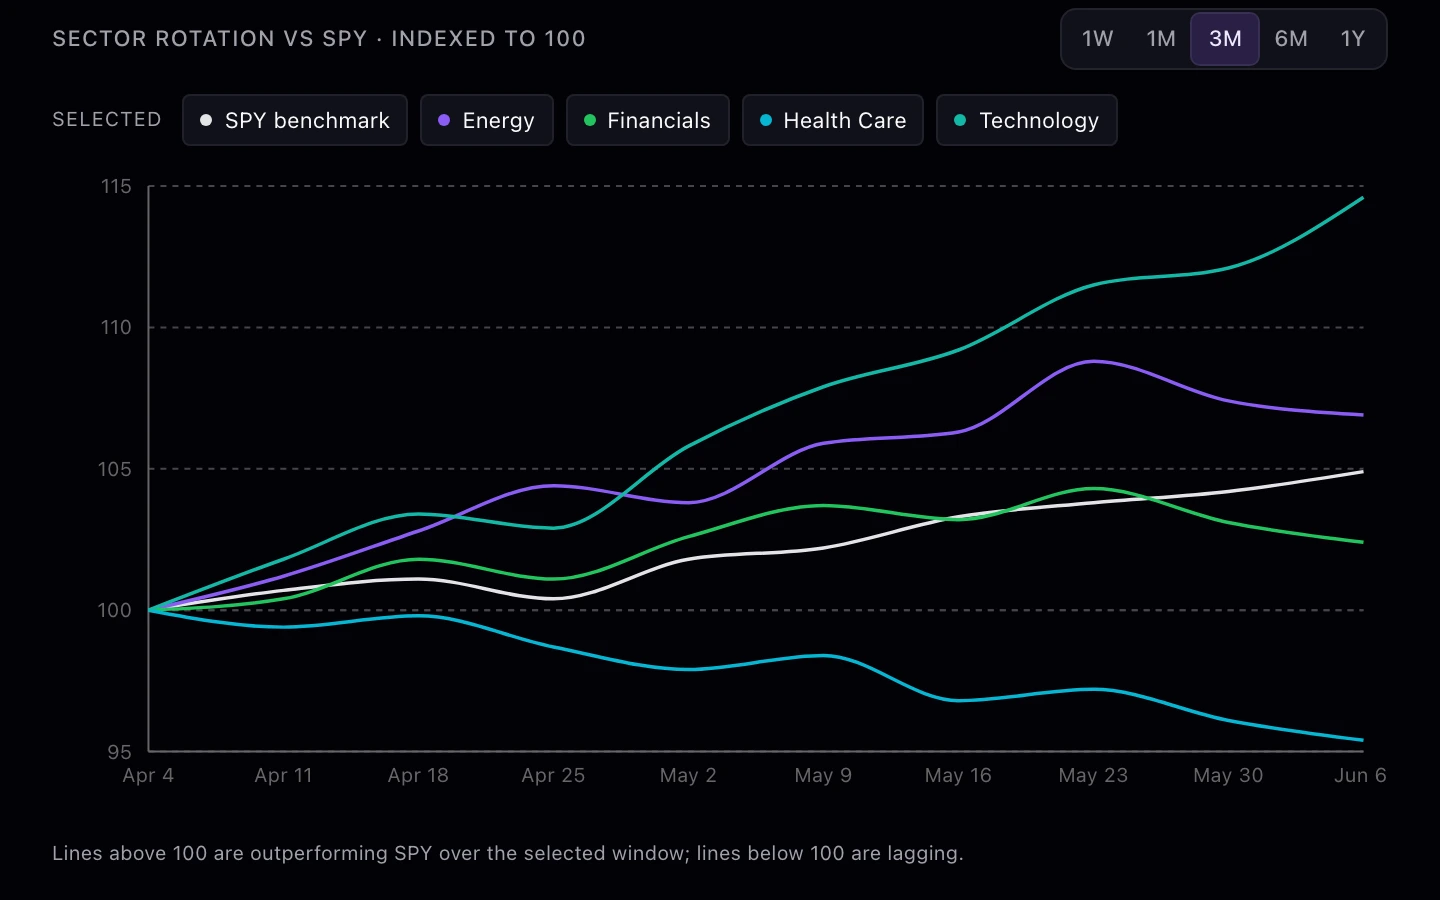
Performance
What led, and what lagged?
Sectors, indexes, crypto and commodities ranked side by side, from one day to one year.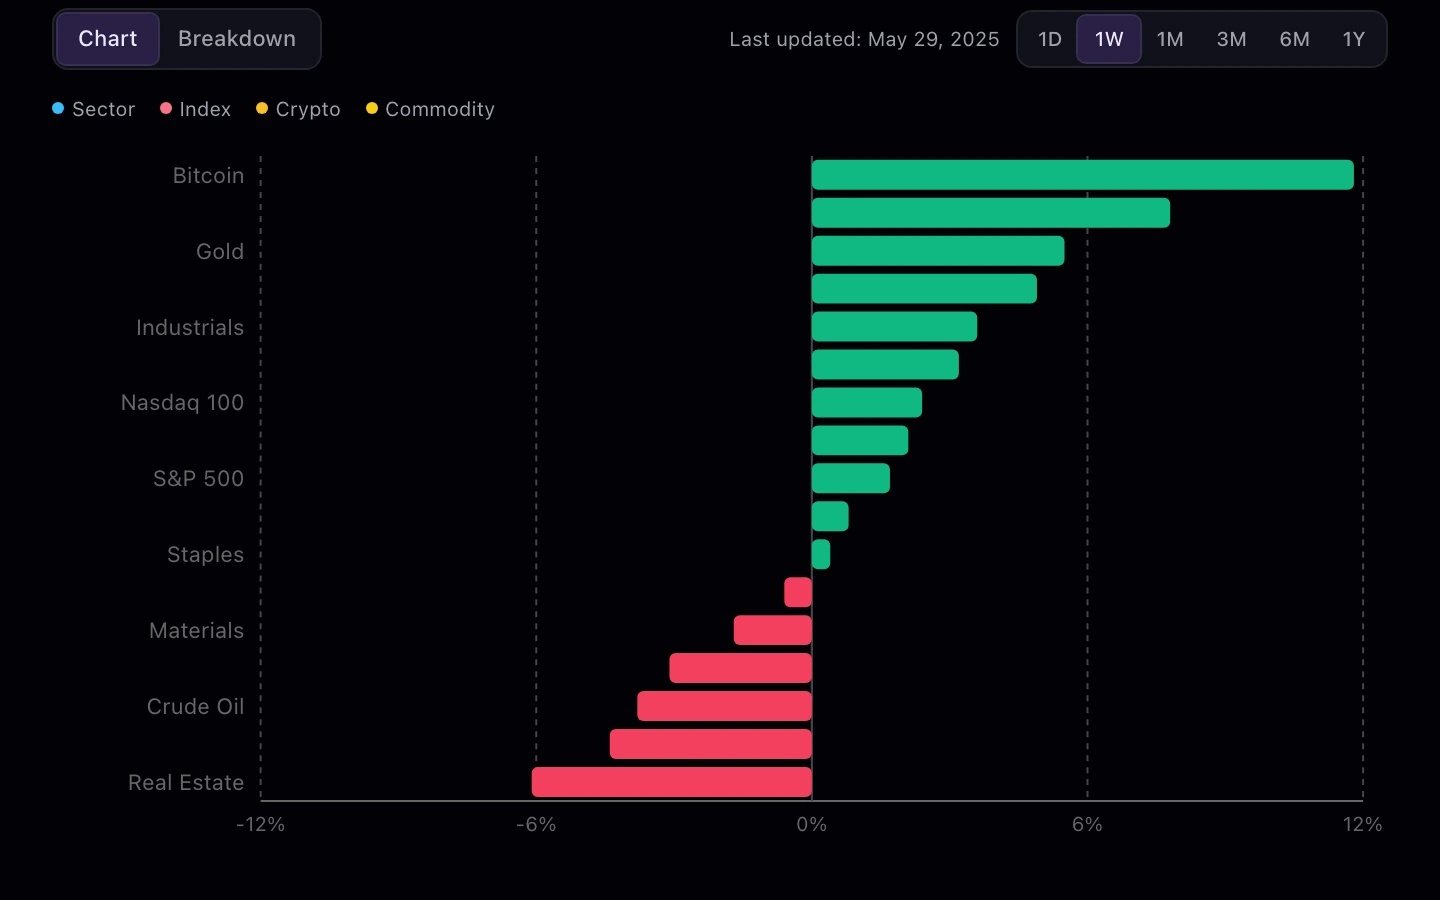
Risk Appetite
Is the market risk-on or risk-off?
Six internals, from high beta against low volatility to credit spreads and the VIX, read into one stance a day.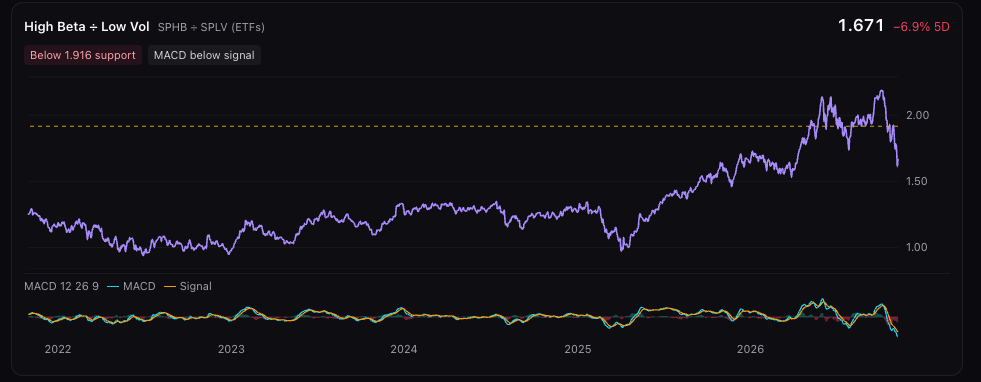
Strategy Lab
Would the finding have made money?
Describe the rule in a sentence and backtest it on up to two years of candles, after costs.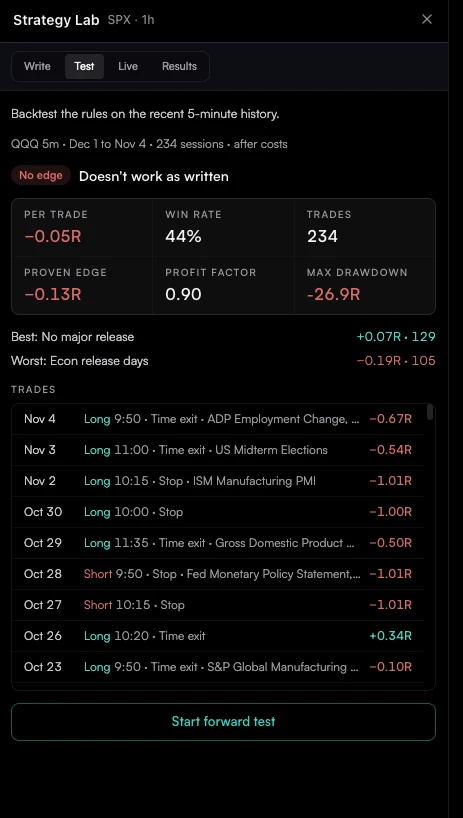
Also for research
Learn the workflow
Tutorials and research for this work.
Questions
Market researchers FAQ
What are the best stock market research tools?
It depends on the question. For event-driven research you want release history with expectations, price reactions after past events, earnings history, sector performance and market internals in one place. Senntric covers those. For full company financial statements, use the company’s filings.
Can I see how the market reacted to past CPI reports?
Yes. Each economic release shows the actual against the forecast and how SPY moved after recent releases, split into above, in line and below the estimate.
Does Senntric have earnings history?
Yes: EPS and revenue against estimates for the last eight quarters, the beat rate, the surprise, the one-day move after each report and the next report date.
Can I backtest a research finding?
Yes. Strategy Lab turns a plain-English rule into exact rules and backtests it on 3 to 24 months of 5-minute, 15-minute or 1-hour candles after costs. Build and test a strategy.